
- Homeownership
- Multifamily Housing
- Nonprofit Facilities
- Special Programs
- Property Managers
- For Investors
May 2016 | DOWNLOAD PDF | CURRENT ISSUE | PAST ISSUES
 Why?
Why?
Rising homelessness in Washington State
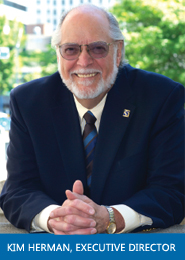
Homelessness in Washington state has been increasing since 2013. That fact has been getting plenty of press—along with attempts at explaining why the earlier successes to reduce the number of homeless people are seeing a reversal. For this issue of My View, I’ve pulled together both data and on-the-ground perspectives from affordable housing experts to explain the recent increase. I hope you find both the data and observations informative and useful.


“Where did all these homeless people come from?”
One theory is that many homeless people have moved here to take
advantage of the services provided in our state (a.k.a., the
“Free-attle” effect).
Barbara Poppe hears this a lot. A consultant working with the City of
Seattle on homelessness issues, Poppe noted in a
recent
Seattle Times
article that city mayors across the U.S. make the same complaint—that
their cities are inundated with homeless people from elsewhere. “There’s
no way all these cities have the Mecca theory under way,” Poppe said.
In Seattle, the data don’t support this theory. Based on ZIP codes given
by homeless people seeking services over the years, some 85 to 90% of
the homeless population in King County is from … King County. That’s
according to data collected by All Home, King County’s nonprofit
partnership that coordinates homelessness efforts.
It’s not true nationwide either, Poppe said. Communities consistently
report about 80% of their homeless population as local, and 90% as from
the same state.
Rents growing, incomes not keeping pace
Housing affordability is a driver of increases in homelessness
Are other macro trends connected with the increase in homelessness?
An Unforgiving Economy
My own view, as I set out looking for clear information, was that declining housing affordability is a critical culprit. However, the true picture is highly complex. Our state, like much of the U.S., is experiencing tepid wage and income growth, along with rapidly rising housing costs. Thousands of foreclosed homes that might have been available for purchase by low- and moderate-income persons were taken off the market and turned into rentals by profit-seeking investors during recent years. At the same time, the market for affordable rental housing is tightening and more people are now renters searching for an affordable place to live. Combined with an expanding upscale housing market being driven by technology company growth in the Seattle metro area, and a lack of affordable homes for sale, the demand for affordable housing is growing while the supply of affordable housing, particularly affordable rentals for very low-income people, can’t keep up with demand.
For very low-income people at risk of becoming homeless or those newly fallen into homelessness, today’s macroeconomic environment is extremely unforgiving. Those who might previously have spent only a short time in homelessness are more challenged to find ways to get back on their feet economically—and secure a home they can afford. One bright spot in this grim picture is how, across Washington State, so many of our public officials and communities are treating this crisis seriously.
Looking at the Numbers
I’ll start with a series of big-picture numbers.
The following two graphs from the Washington State Department of Commerce are included to show how homeless numbers have shifted between 2006 and 2015. These numbers are based on the point-in-time counts of homeless people held annually every January. The statewide numbers for 2016 were not yet available as we were going live with this issue.
Sheltered and unsheltered homeless, 2006-2015
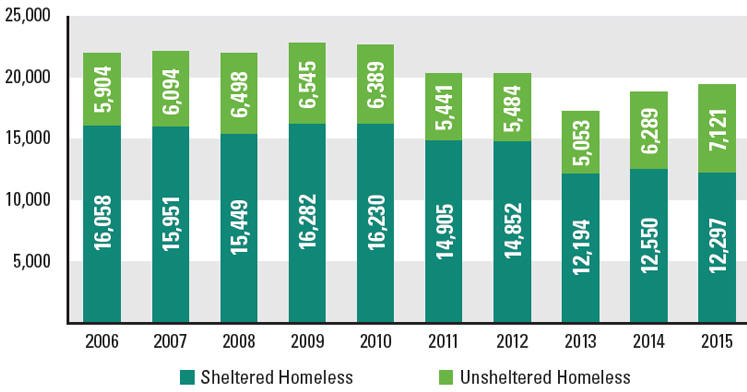
This pattern appears to be continuing in 2016. Some communities have already published their January 29, 2016 point-in-time count numbers. Snohomish County, for example, saw an increase of 54% from 2015 in unsheltered homeless people: 481 people were without shelter on a cold night in January. Kitsap County’s total homeless count was up 30% from last year. King County’s one-night count tallied a 19% increase from last year.
The next graphic looks at our state’s homelessness trends from a different perspective. This data takes Washington’s population growth into account in tracking the change in the number of homeless people. All changes noted are measured against baseline numbers in 2006. This graphic simultaneously highlights the progress made since 2006—along with how these gains are eroding.
Change in homelessness accounting for
population increases
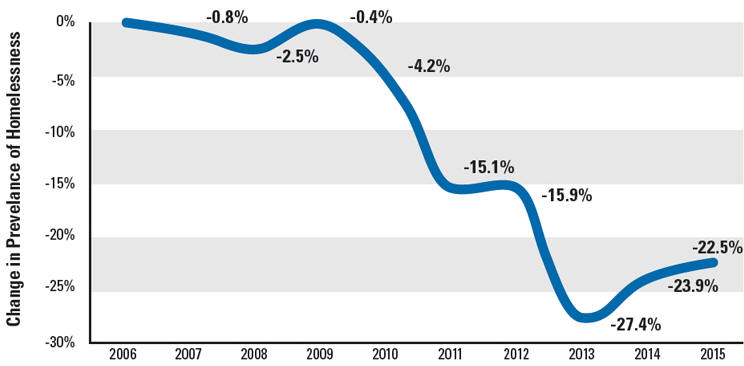

"If we can even be one percent more effective,
that’s thousands of people.”
Tedd Kelleher
Managing Director of Housing Assistance, Washington State Department of Commerce
Rents are growing, incomes are not keeping pace
Much of the data that follows in this next section are the result of Commerce’s careful tracking of our homeless populations.
Commerce is doing tremendous work in coordinating the ongoing efforts mandated by our state’s Homelessness Housing and Assistance Act (RCW 43.185C), which was signed into law in 2005. In addition to coordinating the point-in-time count, providing planning and technical assistance, and managing and passing through to local governments the document recording fees that are targeted to reducing homelessness, Commerce collects and evaluates a wealth of data.
Commerce oversees the state’s Homeless Management Information System (HMIS), which tracks the data gathered on people—those already homeless and those at risk—who seek housing assistance. The objective is to measure the performance of interventions across the state.
Tedd Kelleher, Commerce’s Managing Director of Housing Assistance, has been engaged in Commerce’s housing and homelessness efforts since 2000; he has held his present role for the past four years. More to the point, Tedd is well known among our state’s affordable housing community as a tireless data analyst and resource for those who are looking to track homelessness trends and measure the efficacy of interventions.
For me, the next graphic, also put together by Tedd and Commerce, truly gets to the heart of the matter. In particular, for people in the lowest 20% rung of income in our state, incomes dropped by 7% between 2006 and 2014.1 Median rents, on the other hand, rose by 11% during the same period. Commerce uses the more global concept of “income” for this comparison as it is a more comprehensive measure than wages, and includes other inputs like retirement and disability income, child support, and alimony payments.2
Rents are growing faster than incomes
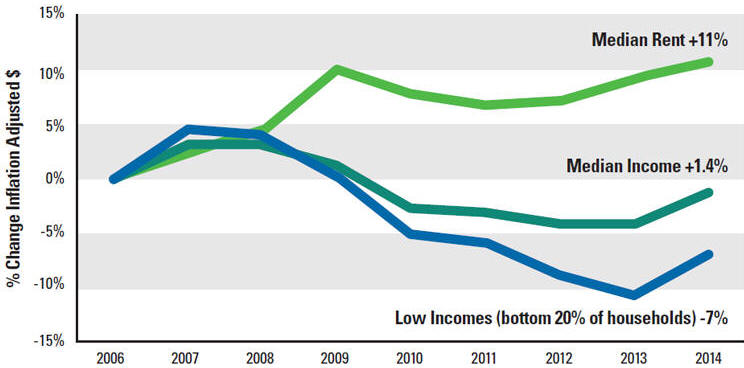
Data sources: U.S. Census Bureau American Community Survey
one-year estimates; inflation adjusted
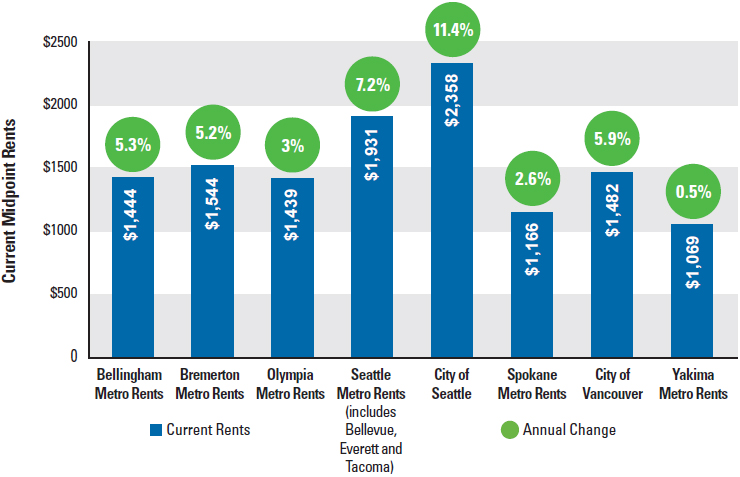
Tedd emphasizes that the “median rent” line shown above is a fairly faithful indicator of the rise in rents across the spectrum of rental costs in our state. “Apartments that are at 25% of median are getting more expensive at a similar rate,” he says. The numbers above give a picture of the challenges for the state as whole; many metropolitan areas have been particularly hard-hit. Data from Trulia indicate, for example, that Seattle median rents rose 38.3% between 2006 and 2014. If you add last year’s increase of 11.4% (see below), that’s a 50% increase in median rents in Seattle since 2006.
To get a sense of rental increases in discrete metropolitan markets across the state, Rich Zwicker, senior policy analyst here at the Commission, dug up data from Zillow on recent one-year increases. The figures below are taken from Zillow’s December 2015 Market Overview. The “Current” numbers represent the midpoint of estimated rents in a given region. All data are for the greater metropolitan areas surrounding these cities—with the exceptions of the City of Vancouver, and the separate data breakouts for the City of Seattle and Seattle’s greater metropolitan area.
Midpoint rent increases in metro areas
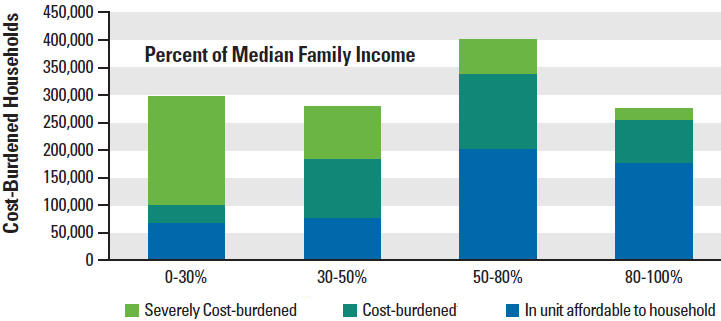
How do income decreases and rent increases impact middle- and lower-income families? That’s the topic of the next graphic from Commerce, based on data from the January 2015 State of Washington Housing Needs Assessment. Cost-burdened is defined as households spending more than 30% of income on housing; those who must pay more than 50% of household income on housing expenses are severely cost-burdened.
In short, the vast majority of those at 0-30% of median family income are either severely cost-burdened or cost-burdened:
Housing cost-burden for middle- and
lower-income families
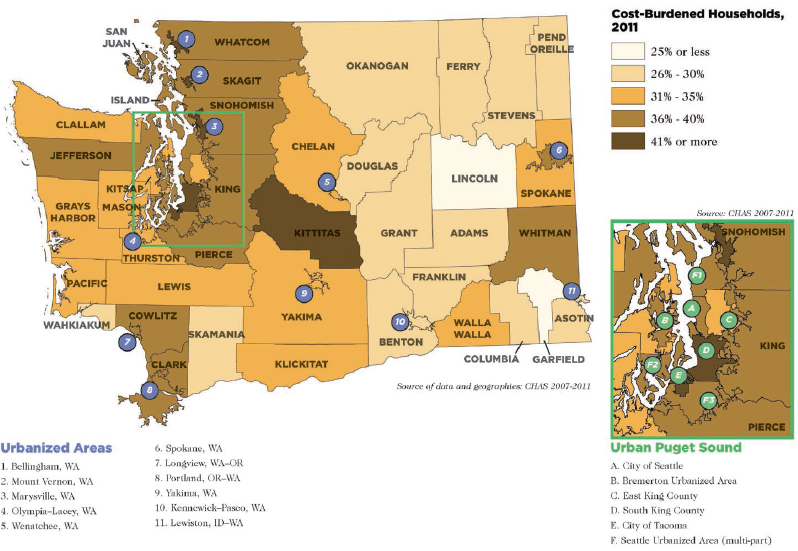
Cost burden is not limited to our metropolitan areas. It is a statewide challenge:
Cost burden is an issue throughout
Washington
Housing affordability is a driver of increases in homelessness
The following statistics make a very clear connection between rent increases and increases in homelessness. These findings come from researchers with the U.S Department of Veterans Affairs, published in the Journal of Urban Affairs:3
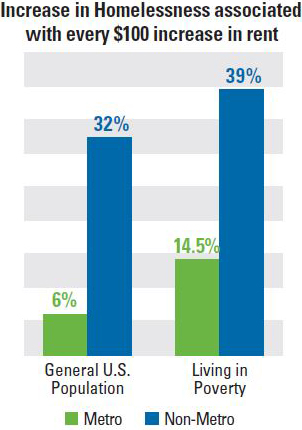 For the general U.S. population, every $100 increase in median rent is
associated with:
For the general U.S. population, every $100 increase in median rent is
associated with:
A 6% increase in homelessness in metro areas
A 32% increase in homelessness in non-metro areas
For those living in poverty in the U.S., every $100 increase in median rent is associated with:
A 14.5% increase in homelessness in metro areas
A 39% increase in homelessness in non-metro areas
The results of this Veterans Affairs study are a sobering confirmation of how absolutely central housing affordability is to solutions for ending homelessness. This data certainly affirms what most of us understand intuitively.

“The real driver of homelessness right now,
is the gap between people’s income and what rents cost.”
Rachael Myers
Executive Director, Washington Low Income Housing Alliance
In a recent conversation, Rachael Myers, Executive Director of the Washington Low Income Housing Alliance, emphasized this connection, along with the responses we should be making. “The real driver of homelessness right now,” she says, “is the gap between people’s income and what rents cost. We need to pass housing levies, we need to fund the Housing Trust Fund—we need all of those solutions that we know provide answers. The solution can’t just be providing more services for people. This is an affordable housing crisis.”
The Veterans Affairs researchers’ conclusions on the determinants of homelessness echo Rachael’s comments. Here’s an excerpt:
… [O]ur findings provide additional evidence that homelessness has its roots in housing market dynamics, and particularly in the difficulty in obtaining affordable housing. …
Our findings on the importance of affordable housing stock for decreasing homelessness underscore the need for policies that either increase the supply of affordable housing or provide additional safety net supports to households to help them afford housing and decrease competition for a finite number of low-rent units.4
Are other macro trends connected with the increase in homelessness?
“People can’t get out”
 In February, Daniel Malone of DESC presented to our Commission as part
of the public hearing for the financing of Estelle Supportive Housing,
DESC’s twelfth supportive-housing property for chronically homeless
individuals. I asked him for his perspective on the increase in
homelessness in Seattle.
In February, Daniel Malone of DESC presented to our Commission as part
of the public hearing for the financing of Estelle Supportive Housing,
DESC’s twelfth supportive-housing property for chronically homeless
individuals. I asked him for his perspective on the increase in
homelessness in Seattle.
“For a long time, we’ve had an “open spigot” of people falling into
homelessness,” he said. “But what’s kept the problem from rising to its
current level is that many people were ‘self-resolvers’ and spending
only a short time in homelessness before getting out on their own.
“But now, people with similar characteristics are finding it much more
difficult to self-resolve, because of the rental crisis. People are
“silting up” in the homeless condition and can’t get out.”
What other factors, in addition to housing affordability, might be implicated in our state’s increasing homelessness—factors like educational attainment, domestic violence rates, substance abuse, family breakups, teen pregnancy rates, divorce rates?
I asked Tedd what his research indicates. Surprisingly, he said these indicators “are all either flat or improving. Actually, they’re mostly improving, which is the good news.”5
Any kind of system failure can lead to homelessness, Tedd points out. This could be a family system (divorce), employment (job loss), or our education system (not getting the needed skills to secure a job that can pay a living wage). Every person facing homelessness faces a different constellation of challenges.
There are a host of tragic circumstances that may create insurmountable challenges for people. Yet—with the notable exceptions of housing affordability, cost burdens, and income and wages for lower-income people—most societal trends simply haven’t gotten worse over the past several years. And they can’t “explain” why more people in our state are becoming homeless.
“We’re definitely re-examining all of our assumptions in real time,” says Tedd. The point is to answer the question: “Are we doing the best things we could do?
“If we can even figure out a way to be one percent more effective, that’s thousands of people,” Tedd says. “Commerce continues to be very focused on making the best use of the resources we have available because it does make a real difference in real peoples’ lives. But we also want to be cognizant of what the larger drivers are.” Tweaking homeless programs can make them better, he says, “but the improvements we’re able to make can potentially be overwhelmed by much larger economic forces.”
Indeed, Commerce’s Homelessness in Washington State, 2015 Annual Report on the Homeless Grant Programs, published in January 2016, paints the status quo bluntly:
In recent years, housing price increases and wage declines for the lowest incomes both nationally and in Washington State threaten the gains made since 2006 in reducing homelessness.
Communities across the state are digging in
As I said at the outset, it has been encouraging to see the commitment of many of our public officials and communities in responding to the current homeless crisis.
Tedd mentions the great work taking place in Snohomish County and the City of Everett, and Whatcom County and its major city, Bellingham, in creating successful responses to the homeless crisis. “Both Snohomish and Whatcom have seen some progress—at least with certain subpopulations. They’ve just really dug in and focused and coordinated their efforts,” he says.

Members of the Snohomish County Human Services team
(from left): Mary Jane Brell Vujovic, Human Services Director; Jess
Jorstad, Homeless Management Information System (HMIS) Program Manager;
Jackie Anderson, Division Manager, Housing and Community Services.
Not pictured: Debbi Knowles, Supervisor, Office of Community and
Homeless Services.
“It’s two trend lines that are diverging
further and further from each other—income stagnation coupled with
increasing rents.”
Mary Jane Brell Vujovic
Human Services Director, Snohomish County
Snohomish County: “We need more affordable housing”
Despite a lot of focused attention on transforming how its communities are addressing homelessness, including embracing a Housing First approach to chronic homelessness, Snohomish County’s 2016 January homeless unsheltered numbers rose since 2015.
What are people living in the county contending with? I received feedback on homeless issues from a core group of associates working within Snohomish County Human Services: Mary Jane Brell Vujovic, Human Services Director; Jackie Anderson, Division Manager, Housing and Community Services; Debbi Knowles, Supervisor, Office of Community and Homeless Services; and Jess Jorstad, Homeless Management Information System (HMIS) Program Manager.
This team emphasizes what they’re seeing in their local communities: a tightening rental market, low vacancy rates, and wages that can’t keep pace. The needs and concerns that people tend to most identify when they contact the homeless system through the county are affordable and safe housing—and jobs and a lack of income growth. “They either don’t have jobs or they are very low-paying jobs, and not full hours,” Jackie notes. “Or they’ve lost a job for some reason. For families with young children, childcare is a significant concern. I think for our people who are homeless and low-income, they’re still challenged to access medical and dental care.”
In terms of declining housing affordability in their county, Mary Jane sums up: “It’s two trend lines that are diverging further and further from each other—income stagnation coupled with increasing rents.”
Jackie describes a new pilot project for the county, focused on families on TANF that include a mentally ill parent who needs targeted help to secure employment. “There are steps we’ve been taking. And obviously some people will benefit from this program. But the bigger issues are a significant barrier for the populations we’re working with: We are way short on the housing piece.”
Historically, she explains, whether for permanent and supportive housing or the county’s rapid rehousing programs, “Housing vouchers worked well. That was when more affordable housing was available. That model is no longer effective for housing people. We need more affordable housing.”

“Jobs have come back. You can probably find
employment … but there isn’t rental availability.”
Whitney Summers
Homeless Navigator
Snohomish County
A separate conversation with Snohomish County Homeless Navigator Whitney Summers adds more insights into the challenges. Whitney works for Catholic Community Services, which contracts with Snohomish County’s Coordinated Entry system to work with homeless people entering the system. Whitney’s designated region is the central part of the county, which includes the City of Everett. She works with a caseload of some 70 to 100 families and individuals.
One reason behind the increase in numbers of homeless people in her area, she believes, is an artifact of stepped-up outreach. In late 2014, the City of Everett launched its Community Streets Initiative, a 23-member task force, to tackle chronic homelessness. “There’s an embedded social worker with the police officers. We’ve got community outreach navigators—I think more people are being reached.”
For families on her caseload who are either homeless or at risk of homelessness, Whitney says, a huge challenge “is the affordability factor. Jobs have come back. You can probably find employment … but there isn’t rental availability. The apartments are full, especially those that are affordable. And because there are so many more renters than there are rentals, landlords are being very picky.” For families who have any kind of history of eviction or a criminal background, “another renter will come along who doesn’t.
“It’s those kinds of barriers that are in the way now. We can help people get employment and access the services they need—but they still can’t secure a home because of the price, or get into them because of their past.”
Veterans’ homelessness: A trend that’s improving
In Snohomish County and across the U.S., one homelessness trend is a positive one: The number of homeless veterans is decreasing. Federal funding targeted to services and housing for homeless vets over the past several years is making a difference. As have the concerted efforts made by many communities.
In 2015, among the federal government’s investments for homeless veterans were:
$300 million to help end and prevent homelessness for veterans and their families through the Supportive Services for Veterans’ Families rapid re-housing and homelessness prevention program
$374 million in case management and clinical services to support 94,966 veterans nationwide through the HUD-VA Supportive Housing (HUD-VASH) program.6
Jackie brought a March 2016 editorial in the Everett Herald to my attention. Titled “Housing the 99 and beyond,”7 its writers commend the progress made in Snohomish County to meet the challenge of veteran homelessness. “99” refers to the number of homeless veterans counted during Snohomish County’s January 2013 point-in-time count:
The 2014 count reported 71 veterans in need of housing. By the end of that year, 87 were housed. The number of homeless vets slipped to 67 in the 2015 count, and 97 found secure housing. During this year’s Point in Time count, 45 veteran households (42 individuals and three couples), were homeless. And work continues to identify homeless vets beyond those counted and secure housing for all.
The groups involved include government agencies such as the Veterans Affairs Supportive Housing, which can offer housing vouchers; the Housing Authority of Snohomish County; WorkSource; Workforce Snohomish; state Department of Corrections; the Navy’s Fleet and Family Support program; and agencies and organizations such as Community Health Center, Therapeutic Health Services, Catholic Community Services, YWCA, Salvation Army and military service groups, such as the VFW.
It does indeed take a village to end homelessness.
From January 2014 to 2015, our statewide numbers for homeless vets were improving as well. The count for 2014 was 1,468 homeless vets; that number was down to 1,293 in January 2015. We have yet to see the certified statewide numbers for 2016.

“We’re amazing at partnering here in Spokane.
It’s this idea of combining strengths, utilizing them to benefit clients
and our community.”
Sharon Stadelman
Director, St. Margaret’s Shelter, Catholic Charities Spokane
Spokane: “We continue to need more resources”
One area where we as a state are also improving is learning what is most effective in helping chronically homeless people and homeless families in achieving housing stability. But securing the resources, housing, and services that will make a difference continues to be a monumental barrier for many.
In the last issue of My View, I talked about the current efforts by the City of Spokane, Spokane County, and many nonprofit partners to work collaboratively to solve homelessness-related community challenges in their region. Sharon Stadelman agrees with that characterization. Sharon is director of St. Margaret’s Shelter with Catholic Charities Spokane, which oversees a broad program of homeless housing options in the community, including shelter services, transitional housing, and rapid rehousing. “We’re amazing at partnering here in Spokane,” she says. “It’s this idea of combining strengths, utilizing them to benefit clients and our community.”
Since the beginning of this year, St. Margaret’s has taken on the role of monitoring and overseeing the Homeless Families Coordinated Assessment grants in Spokane.
In terms of what’s currently prompting families to reach out to the homelessness system, Sharon and her team aren’t seeing any appreciable change. “We’re still looking at those issues of family conflict, domestic violence, and the baseline of economics that are bringing people into the system,” she says. She’s excited about the new diversion services they’re able to offer to families and individuals at risk of homelessness.
Since January, the funding from their new grant supports case management services and resources that help “keep people stable where they currently are—or help to shift them to a different stable option.” Diversion helps people problem-solve to either maintain their current housing or work quickly to resolve their crisis. Strategies like diversion can help to squeeze the most out of what limited funding is available to address homelessness.
Sharon points to her team’s efforts to “help folks in a different way, in a resourceful way. We continue to need more resources in this regard.”
The following data from Commerce underscores how cuts in federal funding are leaving communities scrambling to find ways to make up the difference. The federal government, our largest investor in subsidized housing, has reduced its investment:
HUD Housing Investments Since 2010: Not Keeping Pace
![]() Large cuts in affordable housing programs such as
HOME (-$875 million annually nationwide)
Large cuts in affordable housing programs such as
HOME (-$875 million annually nationwide)
![]() Small increases in other programs such as
homeless funding (+$385 million annually nationwide)
Small increases in other programs such as
homeless funding (+$385 million annually nationwide)
![]() Overall, stagnant federal investments in affordable housing:
Not keeping pace with inflation or population growth
Overall, stagnant federal investments in affordable housing:
Not keeping pace with inflation or population growth
More flexibility is needed—along with greater funding
“It’s important to offer some hope”

Cindy Algeo is the director of the Spokane Low Income Housing Coalition
(SLIHC), and recently announced her retirement after 12 years of
leadership. When I called to ask whom we should speak with in Spokane
about why homelessness is increasing, she gave me several
connections—and then said, “I’ll tell you my view.”
She points out that we’ve been focusing our resources on the most
vulnerable, chronically homeless and mentally ill, as well as
veterans. “That’s one reason why veterans homelessness has decreased so
rapidly.”
However, there’s a flip side. “I get a lot of calls from people who are
at risk of homelessness—but they can’t get even short-term assistance
because there is little or no funding.
“I know they’re not going to score high on the assessment [for level of
need], and I know they’re not going to be served, although local
agencies offer some case management to help them at least a little bit.
I think it’s important to offer some service, or hope, to people who
call. But the resources in the community for them are really scarce.
“This isn’t a dilemma unique to tackling homelessness, but whenever you
focus on a population, another population is going to get shortchanged.”
One topic that frequently surfaces in my conversations with both direct-service people and those involved in developing and managing homeless programs and services, is that more flexibility is needed—both to ensure that funding is going where it’s needed most and that it can be utilized as efficiently as possible.
In a recent article entitled “An Overview of Rural Homelessness,” published by the Housing Assistance Council’s quarterly Rural Voices, Nan Roman and Steve Berg make a parallel argument about understanding and answering homelessness in rural environments: “Homelessness has some different causes, features, and resources in rural places than in cities, and recognizing the distinctions can help in crafting solutions.” They observe:
At present, federal funds are often targeted to permanent supportive housing for people who are homeless for long periods of time and disabled – “chronic homelessness.” This makes sense in urban areas, but chronic homelessness is rarer in rural areas... More flexibility would be helpful when it comes to assigning federal homeless funds to support programs and services that meet their particular needs.
Here’s my perspective on another federal funding shortfall:
The gains made in reducing veterans’ homelessness are the result of Congress allocating money for additional rental vouchers for veterans—as they should have after the long wars. This has served as the backbone of coordinated efforts to house homeless veterans. In our own work at the Commission, we see the impact in the increase in nonprofit developers creating housing for homeless veterans. That’s because the rental vouchers help cover the rents necessary to make the projects financially feasible, and also help cover the needed support services.
If Congress were to significantly increase the amount of financial support for the general population with additional rental vouchers, we would probably experience the same good results. The fact of the matter is that we only serve one out of four of the applicants for public housing vouchers with available funds. Yet these funds would have been cut in 2015 in the HUD operating budget if Senator Patty Murray and Representative Paul Ryan had not worked out the budget agreement that allowed a 30 percent increase in spending on social services and defense above the sequestered budget levels.
Vulnerable Populations
I’ll close this overview with a few final data portraits, along with important observations from Rachael Myers. She brings up two of our most vulnerable populations: children, and people living on disability income.
“For people who are dependent on SSI or other subsidies, these are very small amounts of income,” Rachael points out. And their buying power is shrinking, she adds. The information below comes from the Social Security Administration. These are the maximum allowable SSI payments for eligible individuals, or eligible individuals with a spouse.
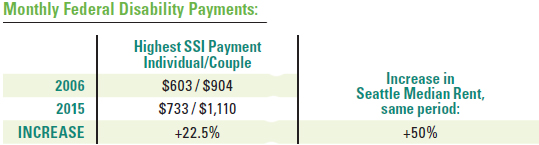
These increases for the disabled, even though at the top of the subsidy scale, clearly are not keeping up with increased housing costs across Washington.
The number of school kids identified as homeless is increasing dramatically. Rachael observes that this is a far larger number than what shows up in the point-in-time counts. It includes a subset of families who are doubled up. That doesn’t mean sharing an apartment to save on rent—it’s families who are temporarily sleeping on a couch or in a spare room, and at risk of ending up on the street. The most recent numbers we have are from the 2014-2015 school year: 35,511 homeless students.8
“That’s a 36% increase in just the last five years,” Rachael says. In addition, she notes, African-American and Native American kids are disproportionately impacted. “They’re three times more likely to be homeless than white kids. This underscores the opportunity gap that already exists for a lot of other reasons.”
And finally, in a recent Seattle Times opinion piece housing leaders Mark Putnam, Lainey Sickenger, and Paul Lambros pointed out that when declaring an emergency regarding the increase in homelessness recently, both King County Executive Dow Constantine and Seattle Mayor Ed Murray asked the State of Washington to re-engage as a partner in ending homelessness. The examples of the state not fulfilling its responsibility for funding the discharge of people into homelessness included:
In King County, about one-third of all foster youth end up homeless
The state mental health system is so underfunded, the only detox facility in King County was forced to declare bankruptcy
Washington’s mental-health system is ranked 47th in the nation in terms of access to mental-health systems
On the positive side, the basic funding for the homeless programs in the state, which comes from document recording fees, is still in place, although a portion of these fees must be extended in the near future or funding will go down.
Final Thoughts
The real stories of homeless individuals and families are always more complicated than the data we have that tries to categorize and understand them. Who and why individuals and families are homeless often escapes easy explanations.
But what is clear in Washington State is that despite our successful efforts to dramatically increase the amount of affordable housing in our state, the reversals in our fight to end homelessness have been caused by the attractiveness of our state’s economy, the steady increases in our state’s population, the cut-backs in federal funding and the combined macro-economic forces of the recent recession that were beyond our control. While basic state funding for homeless programs has been steady and the local efforts of the people fighting to end homelessness on the ground have been remarkable, we haven’t been able to prevent what we hope is a temporary reversal in our progress against homelessness.
The good news is that we are still fighting; mayors and communities are still rallying against homelessness. And, once again on May 11 and 12, at the Spokane Convention Center, the Washington Low Income Housing Alliance will hold its annual Conference to End Homelessness and the people at the front lines of the battle will once again figure out how to bring down the number of homeless people and families in Washington. We can’t give up the fight!
___________________________________________________________________________
- This despite the fact that Washington’s economy is growing. From 2011 to 2014, it grew 4.73% (vs. U.S. growth of 3.84%).
- Median hourly wages for the state as a whole rose from $18.88 to just $22.61 from 2006 to 2014. (Washington State Employment Security Department)
- Thomas Byrne, Ellen A Munley, Jamison D. Fargo, Ann E. Montgomery, and Dennis P. Culhane, “New Perspectives on Community-Level Determinants of Homelessness, Journal of Urban Affairs, Nov. 4, 2012
- op cit., page 621
- To follow up on the sources of Tedd’s data, please see page 2, Homelessness in Washington State, Annual Report on the Homeless Grant Programs, Department of Commerce, December 2014
- https://www.usich.gov/resources/uploads/asset_library/2016_Budget_Fact_Sheet_on_Homelessness_Assistance.pdf
- http://www.heraldnet.com/apps/pbcs.dll/article?aid=/20160316/OPINION01/160319405&template=MobileArt
- 2014-15 Homeless Student Data Report, Office of Superintendent of Public Instruction